Interpreting the results
Exposure limits
Once we have completed our sampling survey, we need to determine what the results mean. Usually, the first step is to compare the results with a relevant occupational exposure limit (OEL).
OELs (also referred to as standards) can help us determine whether exposure to a particular substance is acceptable. Most are health-based. This means that so long as exposure does not exceed the limit it is likely that most workers will not suffer any harmful effects.
A decision will need to be taken as to which OEL will be used for comparison.
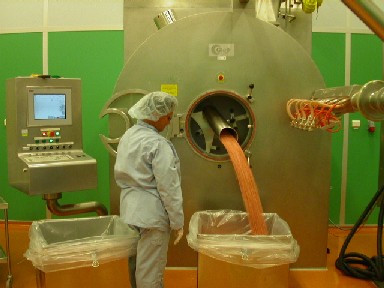
Image courtesy of author
OELs can originate from a number of sources, such as:
- Regulatory: legal limits set by the government with jurisdiction for your country
- In-house: set by toxicologists or other experts
- Recommended professional guidance: for example, the Threshold Limit Values (TLVs) which are set by a professional body of occupational hygienists employed by the US Government. These limits are widely used, sometimes as the basis of legal limits
- Recommended government guidance: in the USA, the National Institute for Occupational Safety and Health (NIOSH) has established a number of recommended limits. Although NIOSH is a government body, the limits do not have legal standing
- Trade organisations: in some cases employer’s organisations employ experts to set guidelines for use by their member companies.
Long and short-term OELs
Long-term OELs, based on the average exposure during an 8-hour work shift, are set for substances that have long-term (chronic) effects where ill health occurs after many months or years following exposure.
Short-term OELs, usually based on the average exposure during a 15-minute period, are set for substances that have short-term (acute) effects, which will normally occur within minutes or hours after the exposure occurred.
Many substances have both long and short-term effects. In these cases, both long and short-term OELs are often set.
Checking compliance with OELs
As we have emphasised, the exposure of a group of workers can vary significantly, depending on a wide range of factors. Keep this in mind when interpreting results.
Say, for example, that all of your sample results are below the OEL...
Do you have an acceptable situation?
In situations where you had collected 5 or 6 samples and none of the results exceed 25% of the limit, you can probably conclude that it is unlikely that the OEL will be exceeded under most normal circumstances (especially if you had chosen samples under worst-case conditions).
On the other hand, if you had collected 5 or 6 samples and one or two of the results were greater than ½ of the OEL, there is a chance that if you had collected more, some results might have exceeded the limit.
What do you conclude if all your sample results are all below the OEL but some are over 25% and a few are greater than 50% of the limit?
The conclusions you draw should be influenced by how many samples you collected along with observations made during the survey. It is also considered good practice to keep exposures as low as is reasonably practicable. Review the risk assessment to see whether there are any reasonable options to reduce the risk further.
If you had sampled a large proportion of the workforce and none of the results are particularly close to the OEL and no apparent problems were observed, it is probably safe to conclude that exposure is satisfactory. However, it is generally considered ‘good practice’ in occupational hygiene to control exposure to < 50% of the OEL.
If one or two of your sample results are over the OEL but many other samples are below the OEL, can you conclude this is safe?
Occupational health practice aims to protect all workers, not just most. If any one exposure is above a level that might result in ill-health to a worker, then some action is required. Calculating statistical means or medians do nothing to aid decisions related to worker health.
If one or more of your samples exceeds the limit and you had collected only 5-10 samples, then you probably should recommend that improvements are needed.
Obviously, your conclusions might be different if you had collected many more samples and all others were well below the limit.
If in doubt, it is best to either assume the worst, or carry out further sampling to obtain more data.
Example scenarios
Scenario 1
6 workers carry out blending of a pharmaceutical product. Sampling has been carried out for the active ingredient, which has an 8-hour OEL of 10µg/m³.
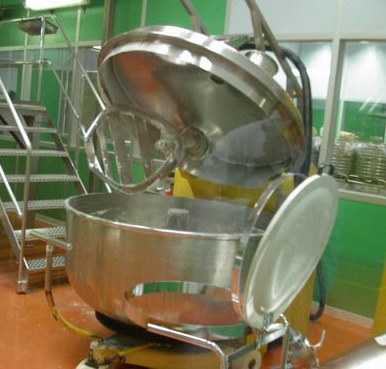
Image courtesy of author
The results from full-shift personal samples are shown in the table below.
Considering the results, do you think exposure is satisfactorily controlled?
A reasonable number of samples were collected and all the results were < 25% of the limit. Unless we noticed anything during the survey that suggested that there could be some problems on other days, we can conclude that exposure is satisfactorily controlled under normal operating conditions.
A separate sample was obtained on the next day for one of the workers during a shift when he experienced problems with the process and had to intervene several times to free blockages. His 8-hr sample result was 8.7µg/m³
Do you think his exposure is satisfactory?
The result was below the limit but over 50% of the OEL. It was also considerably higher than those from the previous survey. It suggests that operators can be exposed to high concentrations when intervening on the machine and may mean improved controls are needed during this task.
Scenario 2
2 welders are working on mild steel components. Sampling has been carried out for total welding fume, which has an OEL of 5 mg/m³.

Image source: http://www.wikipedia.com
The results from personal samples are shown in the table below.
Considering the results, do you think exposure is satisfactorily controlled?
Although we only have a small number of samples, both results are well above the limit. Improved controls are needed here.
Scenario 3
8 maintenance workers carry out repairs on equipment used for the coating of tablets. Sampling has been carried out for the active ingredient, which has an OEL of 10 μg/m³.
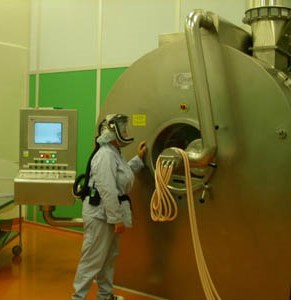
Image courtesy of author
The results from full-shift personal samples collected from 5 of these workers are shown in the table below.
Considering the results, do you think exposure is satisfactorily controlled?
Although we did not sample all the workers, one result was well above the OEL and 2 others were close. It seems reasonable to conclude that there is a good chance that the limit could be exceeded and that control needs to be improved.
The range of the results probably reflects the variation in exposures for this job. For instance, looking at the results by date suggests that the tasks carried out on the 2 days resulted in significantly different exposure patterns.
You might be tempted to disregard the highest result (especially as all the others are below the limit) but you should only do this if you have very good evidence to suggest it is atypical.
Scenario 4
A new product has been introduced which includes an active ingredient with an 8-hr OEL of 50 μg/m³.
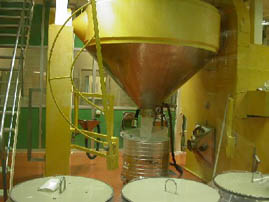
Image courtesy of author
Two full-shift personal samples were collected and analysed for the active substance and the results are shown in the table below.
Considering the results, do you think exposure is satisfactorily controlled?
Although only 2 samples were collected and one was above 50% of the OEL, it would be dangerous to conclude that the limit could not be exceeded. However, looking at it from the other direction, the result was only slightly over 50% of the OEL, and it could be argued that decisions to spend large sums of money on controls should not be made from so few samples. Therefore, it probably would be sensible to obtain more data in this instance.
Unsampled working periods
If a sample is collected over a full 8-hr shift, then the result can be compared directly with the long-term exposure limit.
However, if we collected a sample over 5 hours of an 8-hour work shift, what can we conclude?
We first need to find out what tasks the workers were performing during the period that was not sampled. Often, if we decide that exposure remains relatively unchanged during the shift, the result of our sample will be representative of the average exposure during the shift.
If other tasks were performed, we will need to estimate (or sample) to determine exposure.
There are also situations where the activity that you want to sample lasts for part of the work shift only - so you sample for that time period only.
Because these are not 8-hour time weighted average exposures, how do we interpret the results?
Again, we need to know what workers were exposed to during the periods that were not sampled. Failure to consider this will lead to significant sampling error. If we sampled during a specific activity and the worker is unlikely to be exposed to the contaminant for the rest of the shift, our result will overestimate the 8-hour average. On the other hand, if we sampled during normal activities but missed a period at the end of the shift when equipment was cleaned and airborne concentrations were very high, our result will underestimate the 8-hour average.
In situations like this, we need to obtain some data on the likely concentration during the unsampled periods. We can then calculate the 8-hour average exposure using the following formula:
where:
TWA8 is the 8-hour time weighted average exposure
Tn is the length of time (in hours) when the concentration was Cn
TWA examples
Example 1
If a sample was collected over 6 hours giving a result of 4 mg/m³ and no further exposure to that substance was likely during the shift, then the 8-hour time weighted average is:
Example 2
A sample was collected over 7 hours giving an average result of 2 mg/m³.
During the last hour of the shift, a cleaning operation was carried out. A sample collected during cleaning gave a result of 14 mg/m³. Therefore, the 8-hour time weighted average is:
Non-standard shifts
Even if you have sampled for the worker’s full shift, if the work shift is longer or shorter than 8 hours, you need to adjust your results to the 8-hour average before you can compare your results with the OEL.
To do this you can use the same formula as above (always using 8 in the denominator, regardless of the number of hours worked).
Example
A sample was collected over 7 hours, giving a time-weighted average result of 8 mg/m³. However, the worker is on a 12-hour shift and his exposure remains relatively constant.
Therefore, his TWA during the period we sampled was 7 mg/m³
However, because his shift is longer than 8 hours, his adjusted 8-hour TWA is 12 mg/m³.