Whom and where to sample?
Introduction
When developing a sampling strategy for assessing worker exposures to hazardous substances, it is important to understand the extent to which exposure concentrations can vary.
Because a worker's exposure concentration will vary within the shift, we need to be careful when deciding when to sample and for how long to sample.
The variation between different workers during the same shift, and on different shifts, has to be taken into consideration when we decide who to sample and how many samples we need to collect.
Also, this variability means we need to be careful when we are interpreting the results.
Variation during the shift
The diagram below shows a single worker's exposure pattern for a working shift.
Why would exposure rise and fall during a shift (and not remain constant)?
The amount of contaminant emitted from a particular source can vary during the day, usually due to production factors. Contamination levels vary from place to place within in the workplace; there is often more than one source of contamination, each one emitting the contaminant at different rates, and contamination levels are affected by environmental factors, particularly air movement and temperature. In addition, workers do not stand in one place and will move between areas with different contaminant concentrations.
Why might the potential for exposure vary for different workers carrying out the same task?
There can be many reasons. For example, operators may vary in the way they perform their tasks, their positions and movements within the work room, etc.
Variation between workers
You might expect that the exposure of workers carrying out the same job at the same time in exactly the same way would be very similar.
Let's have a look at some typical sampling results from a survey covering a group of workers weighing out ingredients for a pharmaceutical process. They were all carrying out exactly the same job, so you would probably expect their exposures to be similar. Here are the results:
2.1µg/m³
3.9µg/m³
5.4µg/m³
8.3µg/m³
9.8µg/m³
Notice how the highest result is about 5 times higher than the lowest. In fact, even a range of 10 to 1 would be possible in some situations.
What factors might lead to this variation?
- Although processes might look identical, they can vary so that there are differences in the amount of contaminant generated.
- Even where controls are applied they may vary in their effectiveness. Sometimes this is dependent on how the worker uses the controls.
- Environmental conditions (e.g. air movement) can vary at different locations within a workplace.
- Workers all have their own ways of carrying out a job, which can affect their exposure.
- Personal hygiene and other factors such as height or whether workers are left or right handed can also introduce variations in exposure.
An additional factor that adds to variation between shifts includes changes in the weather (temperature, pressure and humidity).
In an ideal world, we would obtain a sample for all the workers that could be exposed to the contaminants of concern. We would also try to cover all possible variations, such as production rate and time of shift.
However, this is unrealistic, as there will be restrictions on the money and time that can be allocated to any one survey. In practice, we obtain a "sample" of measurement results, which hopefully gives us a reasonable estimate of the "true" range of exposures.
Introduction to practical exercises
When determining whom and where to sample in a workroom, the hygienist often attempts to identify the worker or area with the highest concentration of hazardous agents.
The theory behind this "worst case" sampling strategy is that if you successfully identify the highest exposure groups, then it follows that all other exposures would normally be expected to be below this.
In the following exercises, we will address the question of where and whom to sample.
The exercises will focus on enclosed rooms within a pharmaceutical company, each containing tableting machines, mechanical ventilation (consisting of an air supply at floor level) and a ceiling mounted exhaust. Each of these will be represented by an icon: the tableting machine will be a green rectangle, the air supply a red octagon and the exhaust a white fan shape, as shown below.
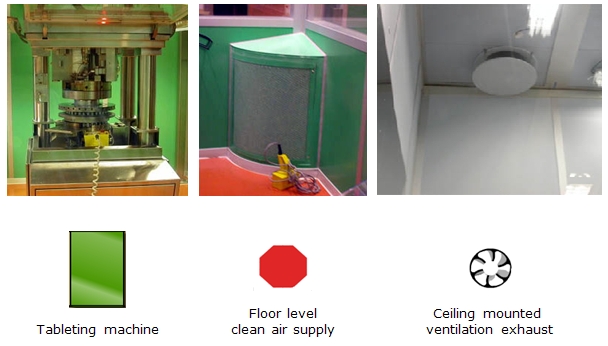
Images courtesy of author
Practical exercise - Room 1
This enclosed room contains a tableting machine.
Potentially harmful dusts might be generated from the machine so you need to identify areas where you might want to collect air samples.
Mechanical ventilation to the room consists of exhaust located at ceiling level and air supply located at floor level.
The black arrows show likely airflow patterns.
In which quadrant of the room would you expect to find the highest concentration of airborne dust?
The top right section of the room is likely to have the highest airborne dust levels.
Practical exercise - Room 2
Below is a tableting room with a different design layout.
In which quadrant of the room would you expect to find the highest concentration of airborne dust?
The bottom left section of the room is likely to have the highest airborne dust levels. As shown by the airflow patterns, the air is carrying the contaminant (released in the vicinity of the tableting machine), towards this area.
Practical exercise - Room 3
Because we cannot sample every worker in every room, we often choose to sample workers that are likely to receive the highest exposure.
Now let's add people into the room and try to decide who we might want to sample.
Which worker you would expect to receive the highest dust exposure (assuming all 3 workers remained in these locations at all times)?
The upper right worker is standing in the section of the room likely to have the highest airborne dust levels.
Practical exercise - Room 4
Now let's see how you do without the airflow patterns.
If each of these production operators performs similar tasks on identical machines, we might want to collect a sample from the worker that is likely to have the highest exposure.
Which worker you would expect to receive the highest dust exposure (assuming all 4 workers remained in these locations at all times)?
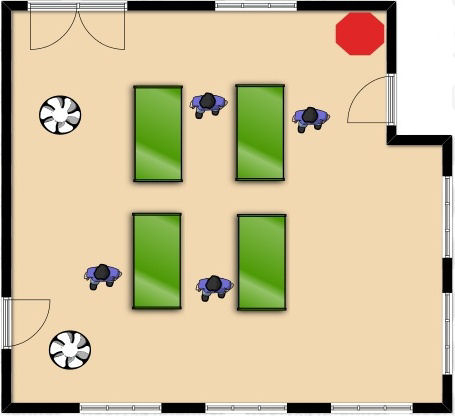
The bottom left worker is standing in an area of the room likely to have the highest airborne dust levels.
Practical exercise - Room 5
In this room there is a Machine Operator and a Technician.
The operator works in the room for 8 hours. The technician only spends about 1 hour per day in this room. However, this time is spent performing machine cleaning and repairing, which is more dusty than simply operating the machine.
Which worker is likely to receive the higher exposure and should therefore be sampled?
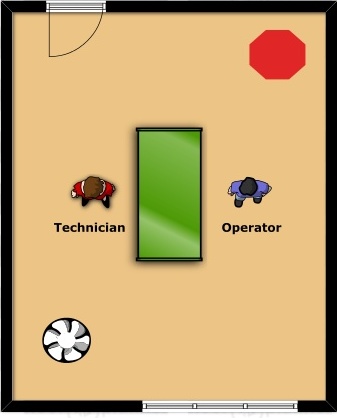
Actually, we do not know which of these workers has the higher overall exposure. If you are unsure, you should consider performing air sampling on both of them. You also need to find out where the technician spends the remainder of the shift.